How to View Page Source on Any Device (Chrome, Safari, Mobile)
A complete step-by-step guide to viewing website HTML source code on Android, iOS, Chrome, Safari, and desktop browsers. Learn URL tricks, flags, bookmarklets, and remote debugging.
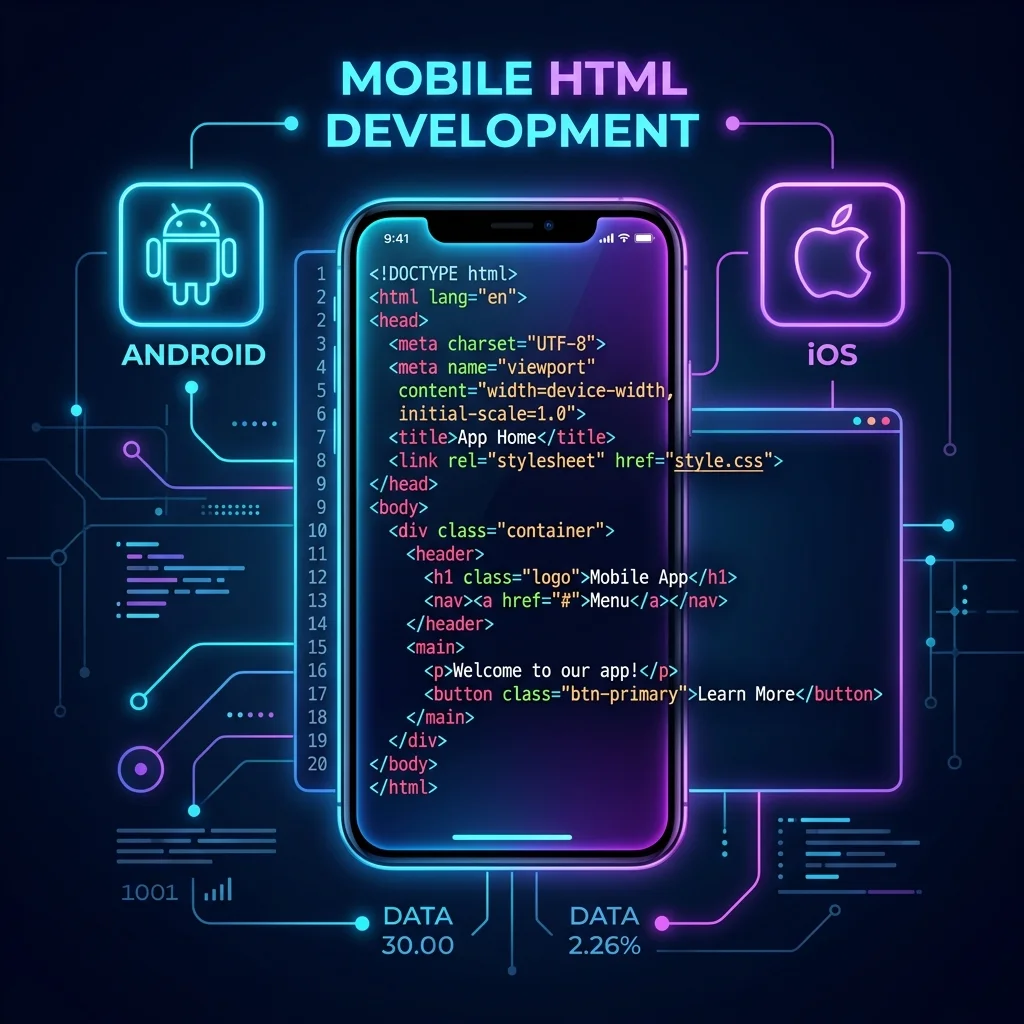
Viewing page source on a mobile device or desktop browser means accessing the raw HTML code of a website directly from your phone, tablet, or computer. Whether you are a web developer debugging a layout, a digital marketer verifying meta tags, or an SEO specialist conducting a technical SEO audit, inspecting source code is the fastest way to get ground-truth data.
The exact method depends on your browser and operating system. While desktop browsers offer simple keyboard shortcuts, mobile browsers like Android Chrome and iOS Safari require URL prefixes, custom flags, bookmarklets, or remote developer tools.
In this comprehensive guide, we cover every practical way to view page source across desktop, Android, and iOS devices. ---
1. Quick Summary: How to View Page Source by Device
| Device / Operating System | Recommended Method | Quick Steps |
|---|---|---|
| Desktop (Windows/Linux) | Keyboard Shortcut | Press Ctrl + U in Chrome, Firefox, or Edge |
| Desktop (macOS) | Keyboard Shortcut | Press Cmd + Option + U (Chrome/Safari) or Cmd + U (Firefox) |
| Android (Chrome/Firefox/Edge) | Address Bar Prefix | Type view-source: before the URL (e.g., view-source:https://example.com) |
| Android (Chrome 90+) | Chrome Flag | Enable flag in chrome://flags for long-press context menu |
| iPhone / iPad (iOS Safari) | URL Prefix or Bookmarklet | Enter view-source: prefix or run a custom JavaScript bookmarklet |
| iPhone / iPad (iOS Chrome/Firefox) | Share Sheet or Menu | Use Share Menu → "View Page Source" or URL prefix |
| Advanced Mobile Debugging | Remote USB Debugging | Connect mobile to PC/Mac via USB using Chrome DevTools or Safari Web Inspector |
| Any Device (Universal) | Free Online Tool | Paste URL into our free Online Page Source Viewer |
2. How to View Page Source on Desktop (Windows & Mac)
Desktop browsers make inspecting source code simple with built-in keyboard shortcuts and right-click context menus.
Google Chrome & Microsoft Edge
Chrome and Edge share the Chromium rendering engine, meaning their shortcuts are identical:
- Windows / Linux: Press Ctrl + U
- macOS: Press Cmd + Option + U
- Right-Click Method: Right-click any blank area of the page and select View Page Source.
Mozilla Firefox
Firefox includes native syntax highlighting and line numbers in its source viewer:
- Windows / Linux: Press Ctrl + U
- macOS: Press Cmd + U
- Selection Source: Highlight a specific block of text, right-click, and select View Selection Source to inspect only that fragment.
Apple Safari (macOS)
Safari requires enabling developer features before accessing source viewing options:
1. Open Safari Settings (or press Cmd + ,).
2. Navigate to the Advanced tab.
3. Check the box labeled Show features for web developers.
4. Once enabled, press Cmd + Option + U or right-click the page and select Show Page Source.
Note: While viewing raw HTML is essential, modern dynamic web applications heavily rely on client-side JavaScript. If your page content renders dynamically, learn why view source isn't always enough for JavaScript SEO.
3. How to View Page Source on Mobile Browsers
Viewing page source on a mobile phone or tablet requires slightly different techniques depending on the browser vendor.
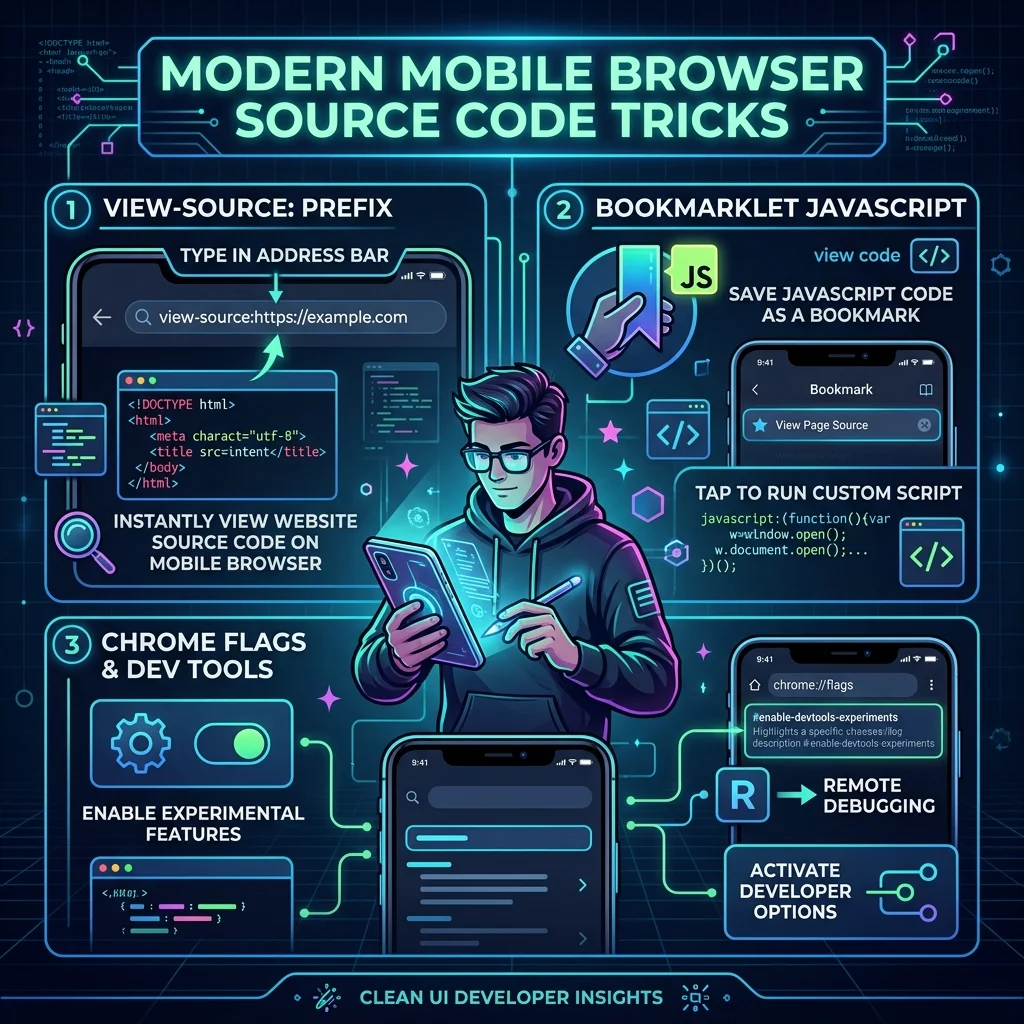
The Universal view-source: Address Bar Prefix
The quickest way to view page source on mobile is to add view-source: before the website address in the address bar. This works on Google Chrome, Mozilla Firefox, Microsoft Edge, and most other mobile browsers.
- Tap the browser address bar.
- Move your cursor to the very beginning of the URL.
- Type
view-source:(for example:view-source:https://example.com). - Tap Go or Enter.
The browser renders the full raw HTML document as plain text. You can scroll through the code, select text blocks, or search for specific HTML tags like Open Graph social tags and hidden tracking pixels.
View Source on Android Devices
▸Android Chrome (Version 90+)
On Android Chrome, you can unlock a native "View page source" context menu item by toggling a hidden feature flag:
- Type
chrome://flagsinto Chrome’s address bar and press Enter. - Search for
Enable contextual menuorContext menu show debug info(flag naming may vary between Chrome builds; search for *contextual menu* or *developer tools*). - Change the dropdown setting from *Default* to Enabled.
- Tap Relaunch to restart Chrome.
- Open any webpage, press and hold (long-press) on a non-link area, and select View page source from the context menu.
▸Firefox for Android
Firefox for Android provides one of the cleanest mobile source viewing experiences: 1. Open any webpage in mobile Firefox. 2. Tap the three-dot menu icon. 3. Select Page → View page source. 4. Firefox displays the complete source code complete with line numbers and color syntax highlighting.
▸Samsung Internet, Opera Mobile & Microsoft Edge Mobile
- Samsung Internet: Tap the bottom-right menu icon (three lines) and select View page source.
- Opera Mobile & Edge: Tap the menu button (three dots) and choose View page source (if present in your version); otherwise, use the
view-source:prefix.
▸Kiwi Browser (Chromium with Extension Support)
Kiwi Browser is a Chromium-based Android browser that supports desktop Chrome Web Store extensions. You can install extensions like *View Page Source* or *Web Developer Tools* directly inside Kiwi to inspect DOM elements and HTML tags with a single tap.
▸JavaScript Bookmarklet Trick
If your browser lacks native source viewing, you can create a reusable JavaScript bookmarklet:
- Bookmark any webpage in your mobile browser.
- Edit the bookmark details and set the URL field to the following snippet:
- Save the bookmark as View Source.
- Whenever you visit a webpage you wish to inspect, open your Bookmarks menu and tap View Source.
View Source on iPhone and iOS (Safari, Chrome, Firefox)
▸Safari on iOS (iPhone & iPad)
Mobile Safari on iOS does not include a native context menu for viewing source code. However, you can use the view-source: prefix trick:
- Tap Safari's address bar.
- Prepend
view-source:beforehttps://(e.g.,view-source:https://example.com). - Tap Go. Safari (iOS 12+) will display the raw HTML source code.
Alternatively, create an iOS bookmarklet with advanced HTML formatting:
`javascript
javascript:(function(){var w=window.open('about:blank');w.document.write('<pre>'+document.documentElement.innerHTML.replace(/&/g,'&').replace(/</g,'<')+'</pre>');w.document.close();})()
`
▸Chrome for iOS
- URL Prefix: Type
view-source:https://example.cominto Chrome iOS address bar. - Share Sheet Menu: Tap the Share icon (square with upward arrow), scroll down the action list, and select View page source (available in select Chrome iOS versions).
▸Firefox for iOS
Open any site in Firefox iOS, tap the main menu button, and choose Page → View page source to open the raw HTML view.
4. Using Mobile Developer Tools (Remote Debugging)
If you need advanced inspection capabilities—such as editing live HTML, tweaking CSS styles in real time, inspecting console errors, or debugging JavaScript—you should use remote debugging via USB.
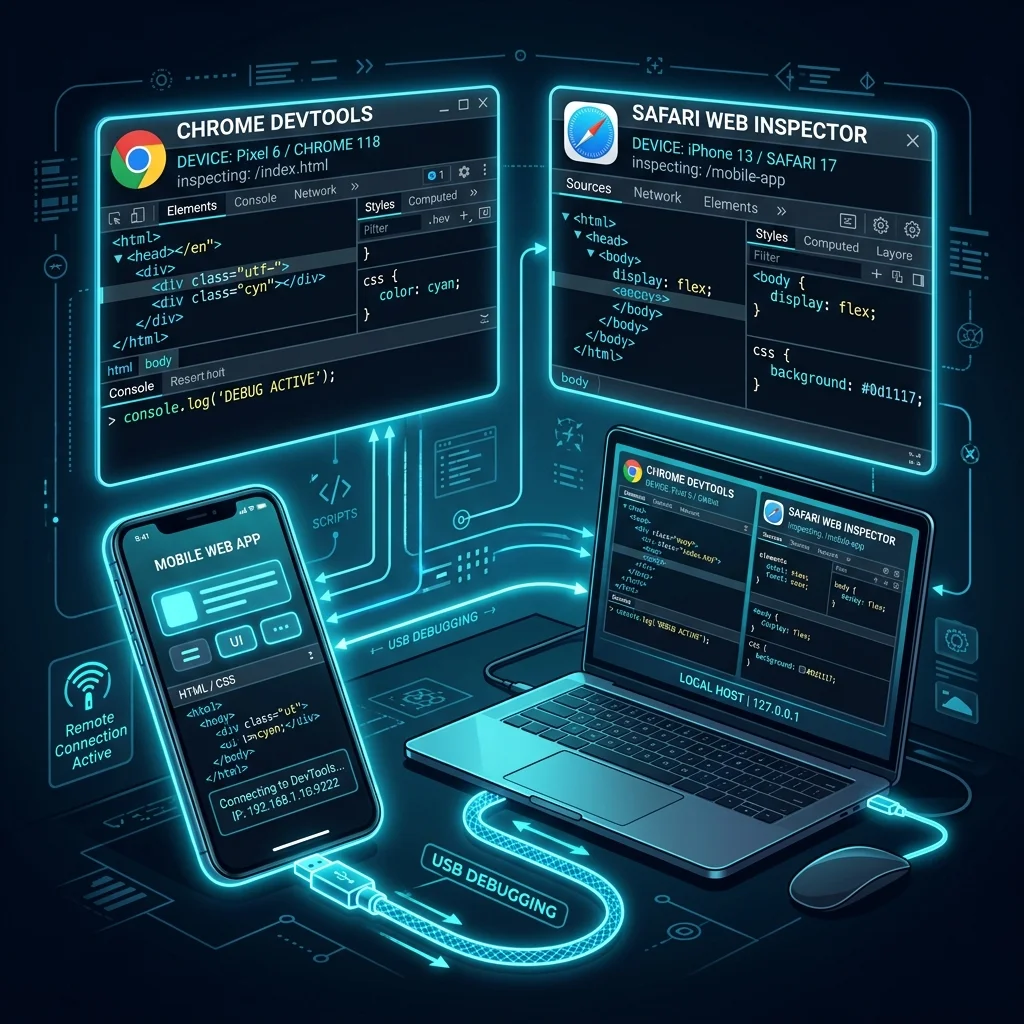
Chrome DevTools Remote Debugging (Android)
To connect your Android phone to desktop Chrome:
- Enable USB Debugging on your Android device:
- Connect your Android phone to your computer using a USB cable.
- Open desktop Chrome and enter
chrome://inspect/#devicesin the address bar. - Ensure Discover USB devices is checked. Your phone model and open tabs will appear.
- Click Inspect next to the tab you want to debug. A full Chrome DevTools window will open on your desktop connected to your mobile phone.
Safari Web Inspector Remote Debugging (iOS & macOS)
To debug an iPhone or iPad using macOS Safari:
- On your iPhone: Go to Settings → Safari → Advanced and enable Web Inspector.
- Connect your iPhone to your Mac via USB cable.
- On your Mac: Open Safari and open Settings → Advanced.
- Check Show features for web developers (or *Show Develop menu in menu bar*).
- In Mac Safari menu bar, click Develop → [Your iPhone Name] → [Selected Webpage].
- The full Safari Web Inspector will open on Mac, reflecting live changes on your iPhone screen.
Firefox Developer Tools Remote Debugging (Android)
- Enable USB debugging on your Android phone as shown above.
- Connect your phone to a computer running Firefox Desktop.
- In Firefox Desktop, navigate to
about:debugging. - Click This Firefox or Network Location, enable USB Devices, and select Connect.
- Click Inspect to launch the MDN Firefox Developer Tools.
5. Third-Party Apps & Online Web Viewers
For users who want a simple solution without configuring browser flags or connecting USB cables, two alternatives exist:
Dedicated Mobile Apps
- Android: Apps like *View Page Source* or *HTML Viewer* available on Google Play provide a lightweight built-in browser that renders code with syntax highlighting and search.
- iOS: Apps like *Source Viewer* or *Web Inspector* on the App Store allow viewing HTML, CSS, and JS files on mobile.
Online Web Source Viewers
If you prefer not to install dedicated apps, you can use an online web utility:
Pasting any URL into our free Online Page Source Viewer allows you to inspect page source code on any mobile browser instantly. The online tool automatically formats raw HTML code, separates inline CSS and JavaScript into clean tabs, provides a one-click copy button, and highlights critical meta tags without needing browser flags or USB cables.
6. Summary of Best Practices
- For Quick One-Off Inspection: Use the
view-source:prefix in Chrome, Firefox, or Safari address bar. - For Daily Mobile Use on Android: Enable Chrome’s context menu flag (
chrome://flags) or use Firefox for Android. - For Daily Mobile Use on iOS: Bookmark the JavaScript source viewer snippet or use Firefox iOS.
- For Development & In-Depth Audits: Use remote USB debugging with desktop DevTools or Safari Web Inspector.
- For Reading HTML Elements: Refer to our beginner-friendly tutorial on how to read HTML source code.
Ready to optimize your site?
Inspect any URL instantly on mobile or desktop without extensions or bookmarklets → Try the free Page Source Viewer
Frequently Asked Questions
Can I inspect element on an iPhone without a Mac?
Yes. You can use the view-source: URL prefix in Safari/Chrome, run a JavaScript bookmarklet, use Firefox for iOS, or paste the URL into our free online page source viewer to inspect raw HTML code without connecting to a computer.
What is the keyboard shortcut to view page source in Chrome?
On Windows and Linux, press Ctrl + U. On macOS, press Cmd + Option + U.
Why does view-source show different HTML than Inspect Element?
view-source: displays the raw HTML code returned directly by the web server. *Inspect Element* displays the live, rendered DOM tree after JavaScript scripts execute, alter elements, and insert dynamic content. For a detailed breakdown, read our guide on JavaScript SEO and rendered DOM vs raw source.
Is viewing website source code legal?
Yes. Viewing HTML source code is completely legal because web servers send these files publicly to your web browser so it can render the webpage. However, copying proprietary code, copyrighted graphics, or brand assets without permission is subject to copyright law.
About the Creator: Hassan
WordPress Developer | 2 Years Experience
Hassan is the lead developer and visionary behind ViewPageSource. As a Computer Science student and WordPress specialist with 2 years of experience in custom theme and plugin development, he built this tool to bring transparency to the web. Hassan focuses on creating high-performance, developer-centric applications that help others understand and audit the technology stacks behind their favorite websites.
Ready to optimize your site?
Use our professional tools to analyze your source code and technical SEO health in seconds.
Start for Free →